By Andy Boston
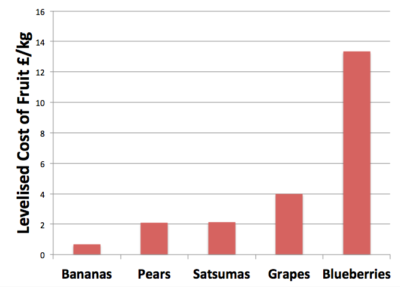
I’ve just done some research on the cost of fruit and to ensure that it’s done on a levelised basis, have quoted all costs in £/kg. Surprisingly (given the distance travelled) bananas are by far the cheapest at £0.68/kg. There are quite a few options around the £2/kg mark (such as satsumas and pears) and then some more expensive ones like grapes at £4/kg and blueberries at an extortionate £13.34/kg. I’ve plotted these on the chart shown here.
It is clear then what we should do! Consumer demand for fruit should be satisfied by importing bananas as far as this is possible, and other fruit only used when the supply of bananas is limited. In these situations it’s OK to use satsumas and pears instead, but grapes should not be bought unless there is a clear pathway to reduce their cost to the same price as bananas. Blueberries should never be used.
I better not pursue this any further for fear of losing any more readers who think it is me that’s gone bananas! Clearly no-one would suggest that fruit should be compared on levelised cost, after all bananas, pears and satsumas cannot be exchanged on a like for like basis.
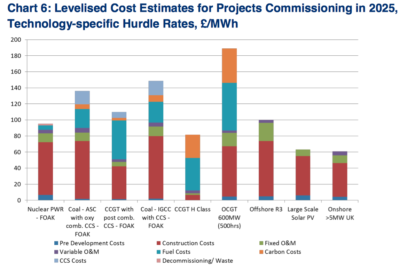
But look here’s a chart released by BEIS this month. It compares the levelised cost of annual energy production (LCOE) from different technologies. It’s tempting to think that this says something about the cheapest way to satisfy our demand for electricity. But of course it is no more valid to say that we should use PV and onshore wind for most of our energy than it is to say we should satisfy most of our fruit demand with bananas. To be fair the report acknowledges that the costs do not take account the system level impacts, and that LCOEs do not provide an indication of future strike prices, but unfortunately that’s how everyone will read them.
Each of the technologies listed offers a range of services to the grid with a different impact on the environment, with different attributes, capabilities and levels of reliability – energy is only one such service. Other services include firm capacity, load following, reserve, response, inertia, black start, voltage control and so on. Historically the grid has been well supplied – a traditional fossil power station provided all of the above, some as a mandatory service, some for free, some remunerated – but in a well-supplied market, prices were low.
However things are changing and we are heading towards a world that is oversupplied with the ability to meet our annual energy needs but lacking in some of these other essential services. To be clear, the value of the overall energy is reducing but the value of many of these other services is increasing.
So to compare an OCGT (which you would build to provide services like firm capacity, reserve and black start) with PV (which you would build to provide low carbon energy) on an energy production basis is bananas! Furthermore technologies that consume energy, like storage, cannot feature in this analysis in spite of potentially providing valuable services.
So what can we say? We need to start talking about the total system cost (after all this is what the consumer will be paying for) and the value of technologies in reducing that cost relative to a default option such as building CCGTs to meet demand. This is a more difficult calculation but it does three important things for us:
- Tells consumers where their bills are heading
- Demonstrates the value (hopefully positive!) of the technologies being pursued.
- Tells us when to stop! As we add capacity of a particular technology to the grid the value of subsequent additions will decline until they hit zero.
So let’s write the obituary for LCOE, to be fair it served us well when comparing fossil plants with each other – just what it was designed to do. But its time has now passed, so a simple epitaph will do: “LCOE – a faithful friend amongst equals now lies here.”